
Today’s knowledge worker finds that to be happy and satisfied in their career, the biggest factor is the opportunity to thrive.
Although we as employers sink countless hours into identifying, vetting, and hiring the best people in the industry, once they are on the team, we tend to focus only on the metrics that can weed out the low performers.
What would shift within our organizations if we placed less emphasis on the metrics of individual performers and a greater focus on our leaders setting them up for success?
Things to know about measuring engineering support:
- The Evolution of Productivity Metrics
- What is Engineering Support?
- How to Calculate Engineering Support
- Engineering Support In Action, Example
- How Will Measuring Engineering Support Impact Your Enterprise?
The Evolution of Productivity Metrics
Back in the 1990s, the big change taking place in software development was the move from procedural code to object-oriented design.
There was considerable research conducted on how this shift would affect developer productivity, and at that time, developer productivity was measured in KLOC: thousands of lines of code. More lines of code signified greater output and a more productive team.
Since then, the software development community has developed and discussed multiple ways of defining the “success” of developers. We have attempted to measure the effectiveness of software developers and development teams by the number of features delivered and counts of function points.
We also introduced the concept of 10x developers: individuals who were supposed to be able to provide 10 times the value and outcomes of the average developer. And recently, Microsoft completed a major study focused on employee thriving, which they defined as being “energized and empowered to do meaningful work.”
To maximize the impact that our teams have on the business, we should rather seek to measure the quality of the support that the organization provides for them.
To that end, we propose a new view of productivity metrics focused on how well we empower our best performers: Engineering Support.
What is Engineering Support?
Below is a dashboard that could demonstrate the overall combined Engineering Support rating over time.
Engineering Support does not measure the output of the teams. The best teams are naturally inclined to do the most impactful and meaningful work possible and will be more satisfied in their careers when given the opportunity.
Instead, Engineering Support measures the quality of the information and instruction we provide to software development teams.
It provides a view into how well the vision of the company is communicated to the teams and how well the company provides the tooling, the standards, and the community of excellence that allows.
To maximize the impact that our teams have on the business, we should seek to measure the quality of the support that the organization provides for them.
How to Calculate Engineering Support
Engineering Support consists of 4 metrics to be tracked weekly:
- Backlog depth (more is better)
- Story development engineer-hour average (less is better)
- Average time to deploy (less is better)
- Average engineer meeting count (less is better)
In order to effectively calculate Engineering Support, it’s important to fully understand each part of the equation. Below, we break down the key metrics and explain the manner we will use to measure each element.
Backlog depth
Improve your team by providing more guidance on what the organization needs.
The raw count of the number of items on the backlog. This intentionally does not take into account story points or any other kinds of measure of size or complexity. Very simply put, the more items in the backlog, the better.
If your backlog has very few stories that are very large, it will theoretically be plenty of work for the team but will require team members to work harder to figure out what to do.
Story development engineer hour average
Improve your team by giving them items that they easily understand and will not have a lot of questions or pushback on.
The calculated average hours per week that the engineers – Devs, SDETS, Data Engineers, or other purely technical contributors – spend on backlog maintenance, backlog refinement, and iteration commitment (either Sprint planning or in Kanban planning sessions).
Scrum Master time, Product Owner time, Business Analyst time, and UX Designer time are not counted in this metric.
Average time to deploy
Improve your team by supporting that they implement clean, efficient build and deploy practices.
The number of hours on average it takes from the completion of a pull request to the completion of the build in the first environment where it is tested.
This is a measure of the quality and stability of your team’s environment management, cloud practices, build and deployment pipelines, and installation process. When code takes less time to get from source control to the working environment, the team gets better feedback on their work.
Average engineer meeting count
Improve your team by giving them uninterrupted time to do their work thoughtfully.
The number of meetings that engineers attend each week on average. This is a raw count of meetings regardless of length. Daily standups, planning, and maintenance meetings all count, so if you have a standup every day, you are starting with 5.
Software analysis and development is deep thinking work and requires uninterrupted stretches of time to do well.
Every meeting is an interruption and regardless of if the meeting takes 10 minutes or 90, when the engineer turns back to their tools and starts working on the problem again, they have to build back up all that thought and remember where they are.
Engineering Support In Action, Example
Engineering Support metrics should be tracked individually at the team level and can also be synthesized into a single KPI for executive visibility each week, as illustrated by the example below.
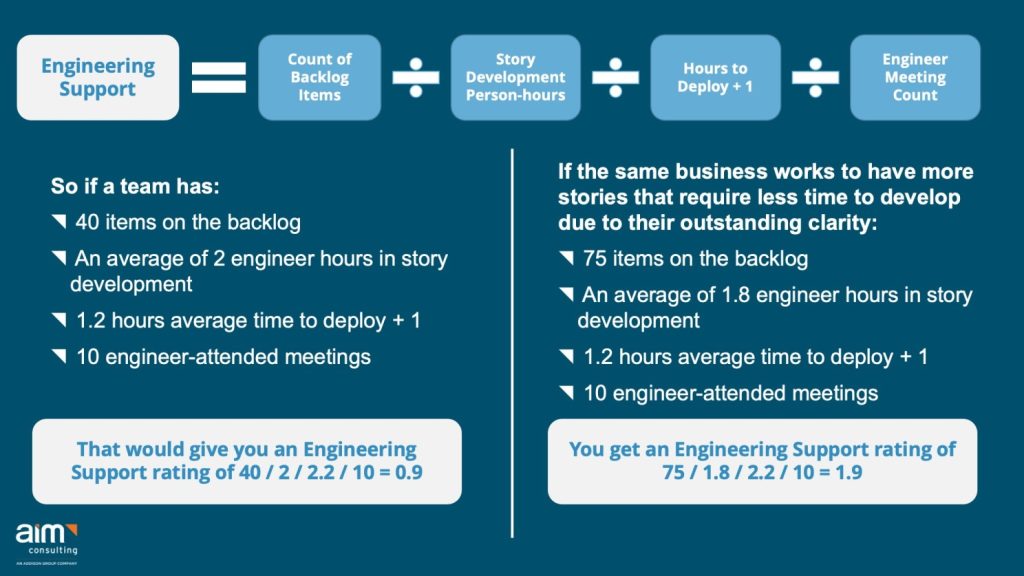
The details:
- Each team will need to track its metrics and take a few weeks to form a baseline. There is no optimal KPI number. Instead of targeting a KPI number that is universal across organizations, each team should focus on improving its engineer support rating from its own baseline.
- Time to deploy is added to 1 so that it does not skew the metrics too significantly when it takes less than an hour for the pipeline to run.
- It is still possible for teams to consistently improve their Engineering Support rating and hang on to other elements of dysfunction or inefficiency. No metric is perfect and this does not claim to be an exception to that rule.
- Engineering Support should be seen very much as a view of effective leadership. To improve your Engineering Support, improve your leadership.
How Will Measuring Engineering Support Impact Your Enterprise?
There is an adage, “When a measure becomes a target, it ceases to be a good measure,” because people will optimize their behavior to improve the measure rather than to meet the goals of the organization.
With that in mind, the danger that we face with the measuring of Engineering Support is teams that are subjected to:
- Richer and deeper requirements
- Less time spent asking questions to figure out what to do
- The best pipeline and environments
- Fewer meetings
I believe you won’t find too many engineers who will complain about that.
Insights By

Need Help Optimizing the Performance of Your Development Team?
AIM Consulting has the capabilities to solve complex technical problems across multiple industries. If you are looking for an experienced partner to implement and sustain change in your organization, modernize your applications, or other means of empowering strategic opportunities, learn about our solutions.